Why Post Engagement, Community Activity, and Influence on External Channels Matter More Than Follower Counts
A large follower count can increase potential reach, but it does not show how many people currently see the content, trust the account, visit its website, or become customers. Followers may be inactive, outside the target market, interested in an old content topic, or acquired through campaigns that attracted little long-term interest.
For businesses and creators, follower count should be treated as one audience-size indicator rather than a complete measure of influence. A more useful evaluation combines post reach, meaningful interactions, community participation, referral traffic, leads, sales, and activity beyond the account’s own feed.
Influence becomes commercially relevant when people do something after seeing the content: discuss it, save it, recommend it elsewhere, visit a product page, join a mailing list, request information, or purchase.
Why Post Engagement and Community Activity Overpower Follower Counts
Social platforms use personalized ranking rather than showing every follower every post in chronological order. Facebook ranks Feed content by predicting what each person will find valuable and relevant. Instagram, TikTok, and LinkedIn also use multiple signals related to the viewer, content, creator, and previous interactions. A follower relationship remains useful, but it does not guarantee distribution.
The Collapse of Organic Reach
The claim that Facebook and Instagram organic reach has universally fallen below 2–5% is not reliable. Reach differs by platform, account, content format, audience behavior, posting time, recommendation eligibility, and whether a post reaches non-followers.
Instead of applying one industry percentage to every account, use platform Insights to compare:
- Accounts reached
- Followers and non-followers reached
- Impressions or views
- Average watch time
- Interactions
- Website or profile actions
Meta defines reach as the number of people who received organic or paid distribution of Facebook content. Its business tools allow account owners to examine actual results rather than estimate reach from follower totals.
Fake Followers Have Zero Commercial Value
Fake or automated followers can distort audience statistics and make engagement rates difficult to interpret. Meta prohibits networks of inauthentic assets used to mislead its systems or artificially increase content distribution.
However, not every inactive follower is fake or commercially worthless. Some people follow an account for occasional updates, read without interacting, or make purchases without commenting publicly.
The practical problem is audience quality. Followers add limited business value when they are outside the service area, unrelated to the content niche, inactive for long periods, or obtained through incentives that attracted people interested only in a prize.
Engagement Is the True Measure of Trust and Retention
Engagement can indicate attention or interest, but it is not proof of trust, satisfaction, or purchase intent. A controversial post may receive thousands of comments from people who dislike the brand. A useful post may generate few public reactions but lead to qualified website visits or private inquiries.
Interpret engagement according to the action:
- Likes indicate a low-effort response.
- Comments may show interest, disagreement, questions, or community participation.
- Saves suggest that users may want to revisit the content.
- Shares can extend distribution to another audience.
- Direct inquiries and qualified clicks are closer to a business outcome.
Engagement should be paired with sentiment, audience relevance, referral traffic, and conversions.
Direct Comparison: High-Engagement Low-Follower vs. High-Follower Inactive Accounts
The table below describes how two accounts should be assessed. It is not a universal performance benchmark.
| Evaluation Criteria | Fanpage A (Fake/Inactive Followers) | Fanpage B (Active Engagement) |
|---|---|---|
| Follower Count | Higher, but audience relevance and activity are uncertain | Lower, with more evidence of current audience participation |
| Average Engagement / Post | Few meaningful interactions relative to reach | Consistent comments, saves, shares, or inquiries from relevant users |
| Engagement Rate | Must be calculated from actual reach or followers; no single percentage defines failure | Useful only when the formula and content objective remain consistent |
| Algorithm Rating | Platforms do not publish a simple “boring content” score | Relevant interactions may support distribution, but hundreds of other signals also matter |
| Omnichannel Conversion (CTR) | Must be measured through tagged links and conversion events | More valuable when engagement produces qualified traffic or completed actions |
| Ad Costs (CPM/CPC) | Organic inactivity does not automatically cause an advertising penalty | Organic engagement does not guarantee cheaper ads; auction, audience, creative, objective, and relevance also affect cost |
| Brand Sustainability | Weak when the audience does not return, recommend, or convert | Stronger when participation continues across posts, communities, websites, reviews, and direct channels |
Google Analytics can classify incoming traffic by channel and show where website visitors originate. Tagged campaign links make it easier to distinguish traffic from individual social networks, posts, and campaigns.
How Social Media Algorithms Decide Which Posts to Distribute
There is no universal hierarchy in which likes always receive the lowest weight, comments receive a medium weight, and shares or saves always receive the highest weight.
Facebook predicts which content each person is likely to find valuable. Instagram uses thousands of signals and makes different predictions for Feed, Stories, Explore, and Reels. TikTok considers user interactions, video information, and device or account settings, while LinkedIn says its Feed uses hundreds of signals related to the post, profile, network, and member activity.
A completion, save, comment, or share may be important in one context and less useful in another. The same action can also have different meanings. A share may represent endorsement, criticism, or private discussion.
Creators should avoid manufacturing interactions. Meta identifies clickbait and engagement bait as low-quality content that may receive reduced distribution. Asking for genuine feedback is different from instructing users to comment an unrelated word solely to manipulate reach.
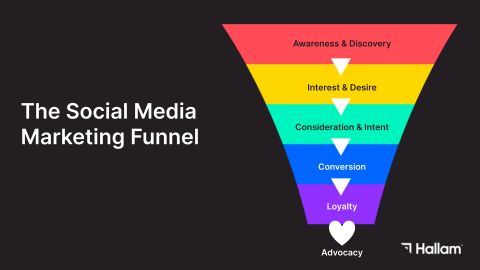
Categorizing 3 Levels of User Engagement: From Passive Viewing to User-Generated Content
Level 1: Passive Engagement
Behavior: Viewing a post, watching part of a video, opening a profile, or reading without leaving a visible reaction.
Significance: Passive activity can build awareness and familiarity. It should not be dismissed merely because it produces no comment. Measure video retention, completed views, profile visits, search activity, and later website sessions where the platform provides those signals.
Level 2: Active Discussion & Engagement
Behavior: Commenting, asking a relevant question, saving a guide, sharing content, responding to a Story, or sending a direct message.
Significance: These actions provide stronger evidence of interest, but purchase intent should not be assumed. A pricing question may be commercially valuable, while a long argument may produce engagement without generating revenue.
Respond according to the user’s need rather than treating every comment as a sales lead.
Level 3: Value Creation & Advocacy (UGC)
Behavior: Publishing a review, demonstration, tutorial, comparison, unboxing, or independent recommendation involving the product or brand.
Significance: User-generated content can influence brand perception and purchase decisions, but its effect depends on credibility, relevance, product category, and audience. A 2026 systematic review covering 60 peer-reviewed studies found recurring links between UGC, trust, engagement, and purchase intention, while also emphasizing that outcomes vary by context.
UGC is not automatically free. Brands may need permission management, moderation, customer support, product samples, creator compensation, or disclosure procedures.
Platform-Specific Engagement Optimization Strategies
1. Facebook & Facebook Groups (Focus on Community Discussion)
Strategy: Build discussion around a defined problem, profession, interest, or customer need.
Optimization Tactics: Publish useful prompts, answer recurring questions, organize resources, and moderate spam. Avoid engagement bait, forced tagging, and unrelated “comment to win reach” tactics. Meta explicitly discourages artificial requests for reactions, shares, and comments.
2. TikTok & Reels/Shorts (Focus on Watch Time & Saves)
Strategy: Communicate the subject quickly and give viewers a reason to continue watching.
Optimization Tactics: Test different openings, pacing, lengths, and explanations. Review average watch time, completion behavior, views, likes, shares, and comment insights in the available analytics. TikTok identifies watch time, completion, interactions, captions, sounds, and hashtags among the information used by its systems.
A fixed three-second hook is a creative convention, not an official rule that applies to every video.
3. LinkedIn (Focus on Professional Context & Document Shares)
Strategy: Publish information relevant to professional roles, industries, careers, or business decisions.
Optimization Tactics: Share original observations, documented case studies, practical lessons, and clearly labeled data. LinkedIn supports PDF, PowerPoint, Word, and other document uploads and recommends professional knowledge-sharing topics. It does not state that document posts always receive greater reach or that dwell time alone controls ranking.
4. Instagram (Focus on Saves & Direct Messages – DM)
Strategy: Combine visual clarity with useful information and appropriate conversation tools.
Optimization Tactics: Use Stories, polls, questions, and other available stickers when they serve the content. Instagram supports interactive stickers, while its ranking systems consider different signals for Feed, Stories, Explore, and Reels.
Automated keyword DMs should provide the information promised and comply with platform and privacy requirements. They should not be used to inflate interaction counts artificially.
Step-by-Step Guide to Building a Standard 70-20-10 Content Strategy
The 70-20-10 framework is a planning heuristic rather than an official platform formula or a scientifically proven optimal ratio. It should be treated as a flexible starting point, with the proportions adjusted based on audience behavior, campaign objectives, sales cycles, and available resources. In this model, approximately 70% of your content should focus on delivering value by helping the audience solve problems, understand a topic more clearly, or make better decisions. This category commonly includes tutorials, explanations, checklists, demonstrations, original research, and answers to recurring questions. While the primary purpose is education, value-driven content can still include relevant product references and does not need to exclude commercial information entirely.
Around 20% of your content should be dedicated to strengthening community relationships and encouraging ongoing participation. Effective formats include behind-the-scenes posts, user-generated contributions, polls, interviews, event recaps, and responses to common community discussions. Success should be evaluated by metrics such as repeat contributors, the quality of interactions, community retention, and the number of audience questions that inspire future content. The remaining 10% should focus on conversion by providing interested users with a clear next step. This may include product pages, consultations, demonstrations, free trials, promotional offers, customer case studies, or campaign landing pages. Rather than measuring these posts solely by likes or engagement, performance should be assessed using outbound clicks, qualified leads, completed purchases, assisted conversions, and overall revenue generated.
Follower count shows potential audience size, not guaranteed reach, trust, or commercial influence. Engagement provides additional evidence, but it must be interpreted according to content context and audience quality. The strongest indicators connect social activity with outcomes outside the post: relevant discussions, returning community members, website visits, branded searches, leads, reviews, recommendations, and sales.
Audit current performance using one consistent reporting period. Calculate engagement using a clearly stated formula, then compare reach, saves, shares, qualified comments, referral traffic, and conversions. Use the 70-20-10 structure as a testable starting point rather than a permanent rule. Review the results regularly and move resources toward the content that produces useful audience actions and measurable business outcomes.